
There’s a lot of useful data that can be gleaned from intelligent buildings which is of value to end users and other stakeholders involved in their operation. Energy managers can use building data to report on the energy usage, while C-Suite and finance departments can use a building’s data to analyze operating costs, and HR can use it to optimize space utilization and occupant comfort. Unfortunately, building automation operating and monitoring workstations have traditionally catered to the facility operator/manager, who has different needs and a more technical skill-set when it comes to graphics.
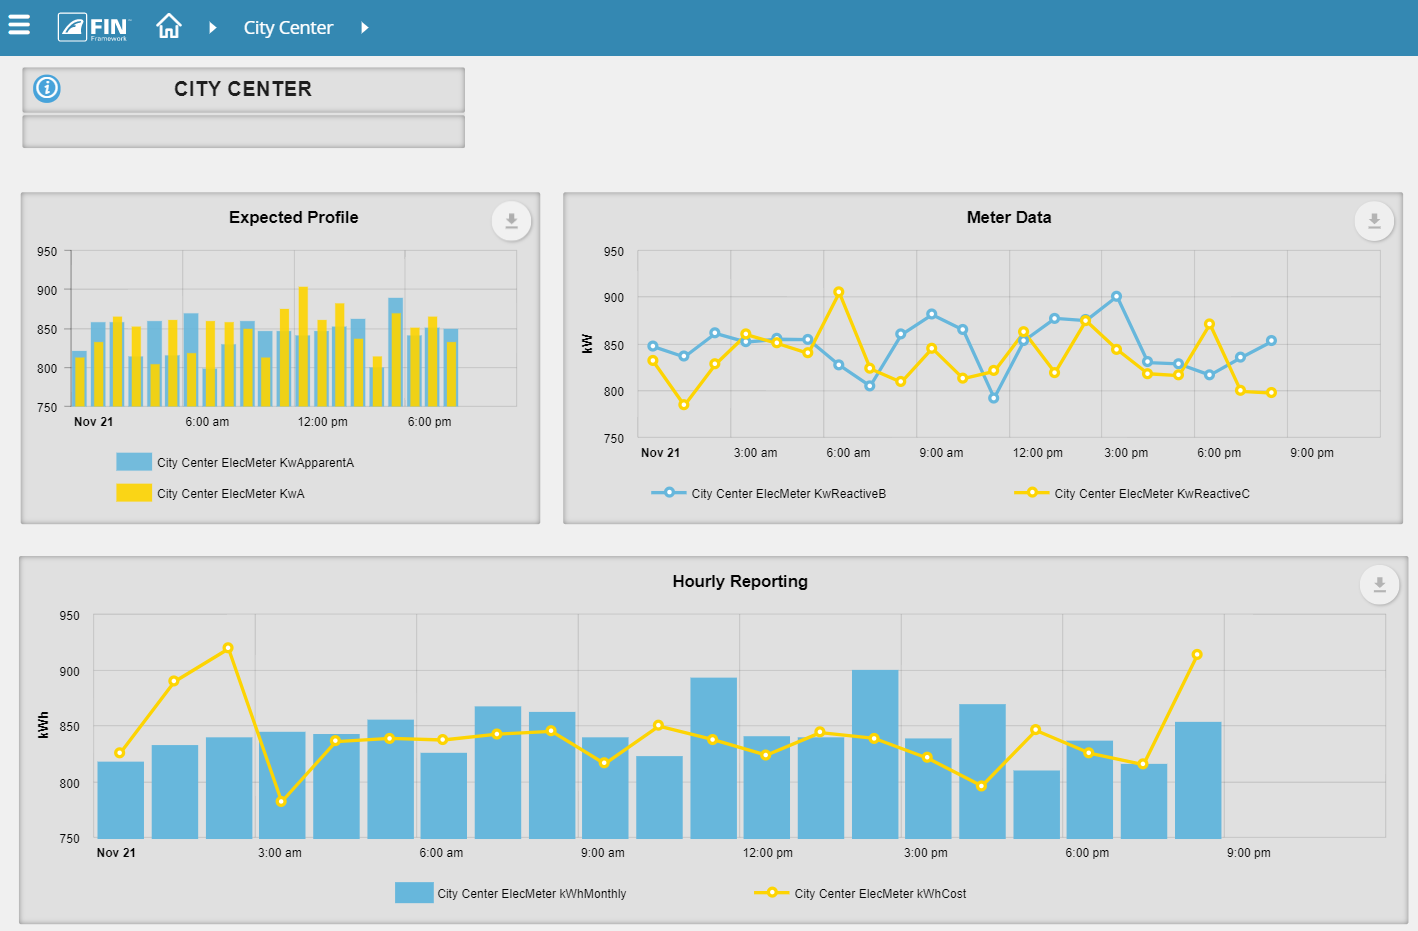
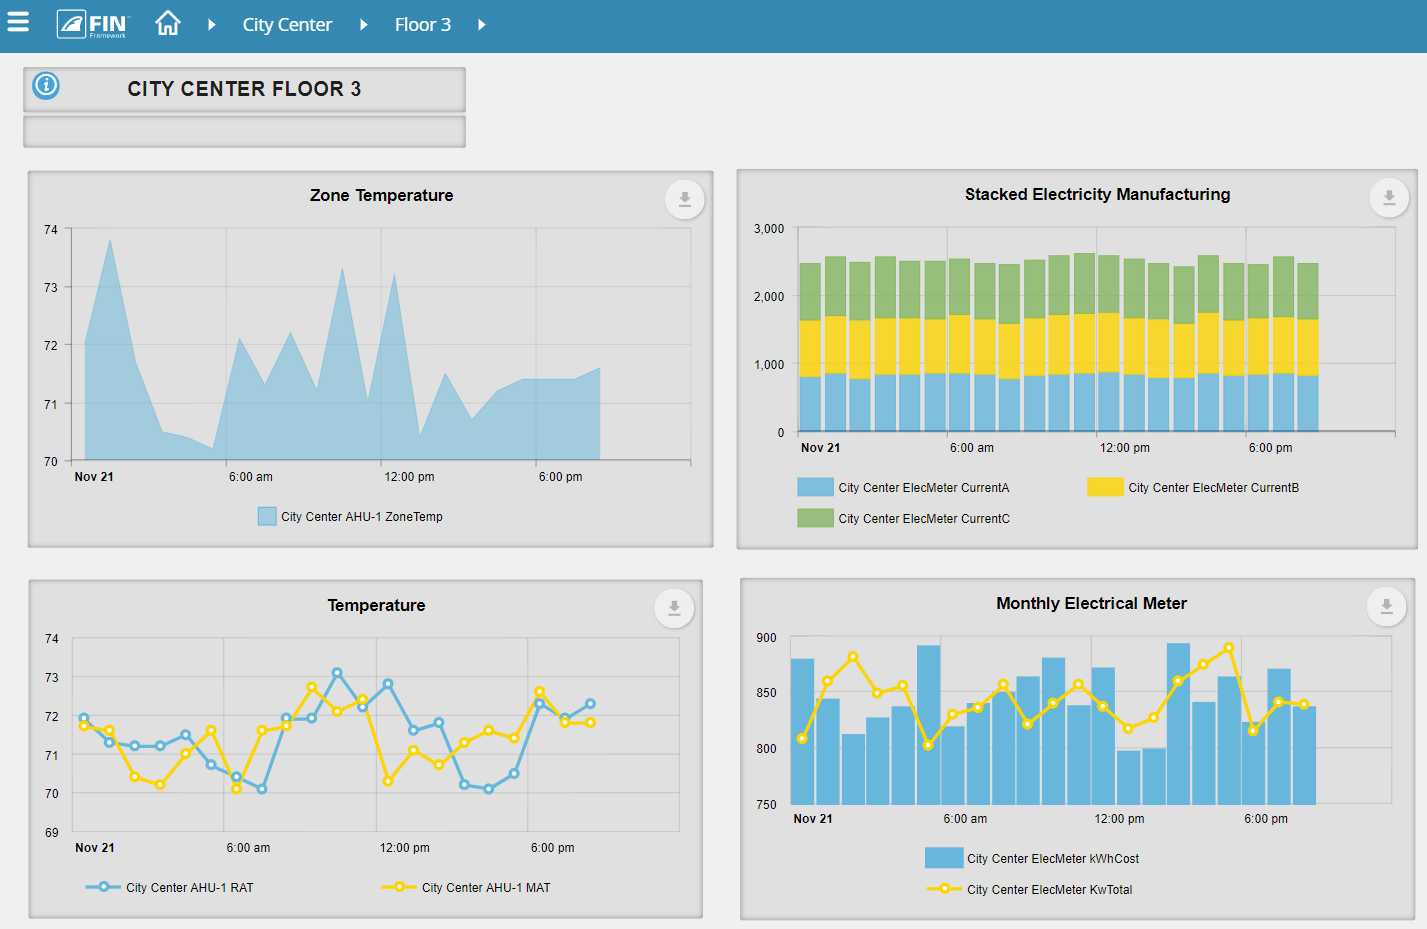
The challenge inherent in providing additional stakeholders access to a building’s data is the way it is presented. End users typically digest or consume information differently from the way a technician does, and thus need simplified charts, KPIs, and higher-level overviews of performance, comfort, and utilization of the facility. Delivering data in this way requires different UI elements that are more interactive - like those typically found in business intelligence user experiences. Users need to be able to manipulate the timeline and inputs to visualize different use cases or scenarios.
There are lots of great use cases for empowering end users with a building’s data that can lead to improved efficiency, reduced energy consumption, and reduced operating costs. What if each stakeholder had all the data about the building operations they needed at their fingertips? This would empower additional stakeholders and end users and put less burden on your facility manager and system integrator.
The challenge is that data charts are very complex and difficult to set up, requiring developer skills to define the queries and code the properties. Not only do you need to set-up charts and graphics, but you also need to design interactive dashboard components. A good dashboard provides a simplified and clear visualization of KPIs (Key performance indicators), high-level summaries, and an interactive environment that makes it easy for a user to manipulate and analyze the data. Dashboards like those used in business intelligence require developers who have strong design and UI/UX skills - skills that a system integrator typically does not have.
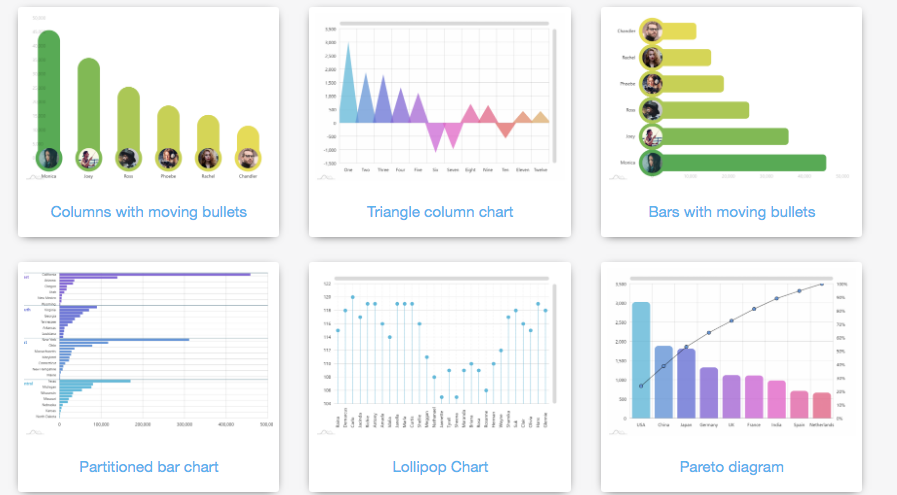
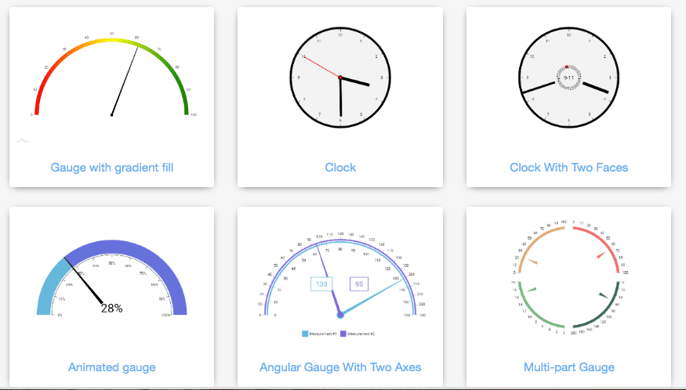
We know and understand this challenge at J2 Innovations. That’s why we partnered with an industry leader in data visualization (AM Charts) to incorporate their ever-growing library of data visualizations from basic to advanced. Our OEMs, who typically have designers and developers on staff, can use our APIs to pull in and visualize the data using the AM Charts library built into FIN and create dashboards for specific users and use cases. The AM Charts library offers column and bar, line and area, pie and donut, XY and bubble, maps, stock, timeline, pictorial, gauges, radar and polar, and so many more options.
For developers, the code examples from AM Charts can be copied and dropped into FIN, where they can leverage our APIs to get the data and automatically draw the visualization. Here’s a developer example.
For System Integrators and End Users, we put together a variety of easy-to-use charts and gauges that can be dragged and dropped using the Graphics Builder. Each component has built-in configuration properties so users can edit color, style, and data points. This allows users to create fully customizable dashboards quicker and easier than ever before.
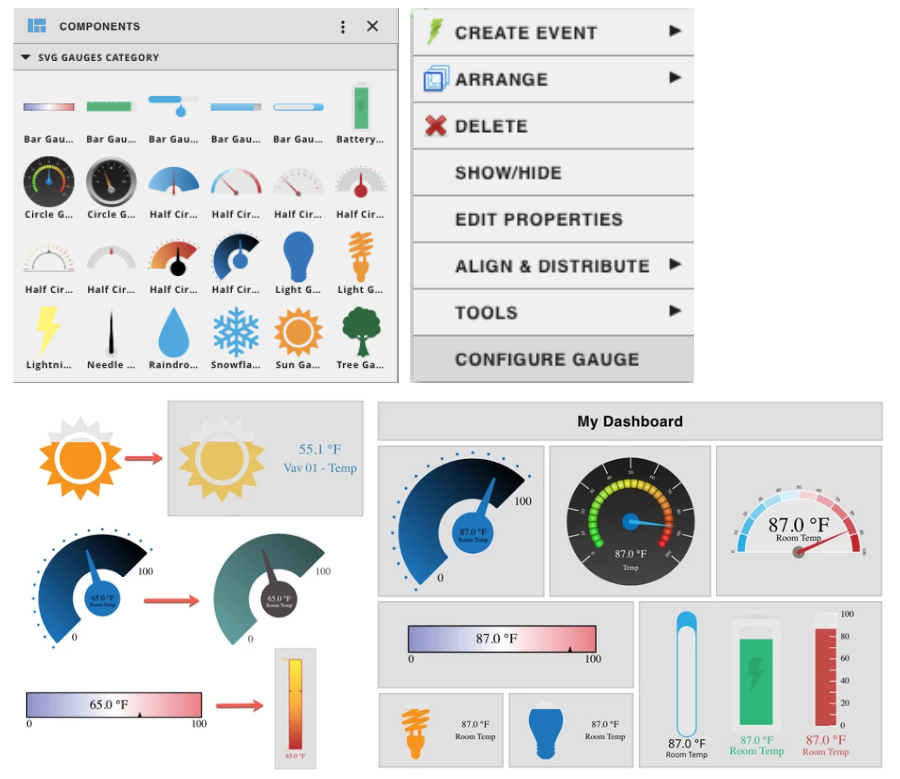
Check out the video below for some great examples.
Topics from this blog: End User Graphics Builder FIN 5.0 Integration
Back to all posts