All building automation operating and monitoring software has some capabilities of charting historical data. Traditionally this requires technical expertise to query the points, as well as to configure the chart/visualization. Additionally, each time a new piece of equipment or collection of points is analyzed, the process has to be done over and over again.
Wouldn’t it be great if you could save a configured chart? And even better, what if that saved chart could be relativized across all similar equipment in a smart building? Your FINtastic Tip today is with FIN’s Historian App, you can create and save a chart once, and use it everywhere.
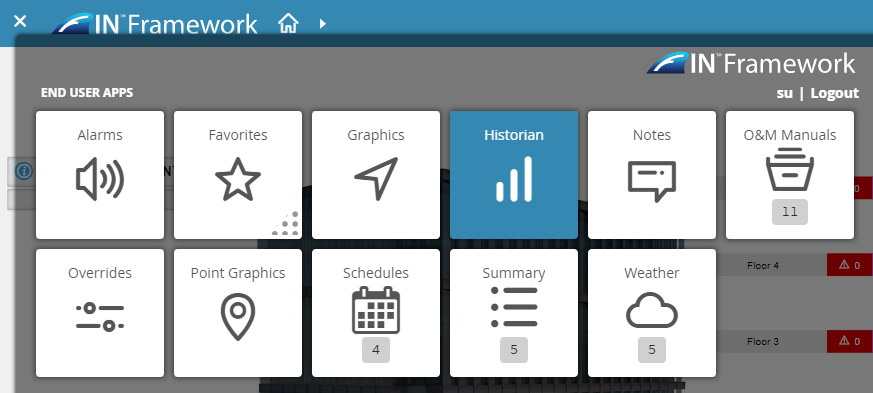
In buildings, there is a lot of typical equipment that gets analyzed using charts. Using the Historian App, you can configure a chart for a piece of equipment, and reuse that by saving the chart.
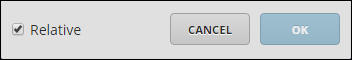
If you are building a chart on an equip that has other equips of the same type, (like a ReheatVAV), you can select the 'Relative' option. Then if you save the chart, the saved chart will appear in the Historian on every equip of that same type.
To learn more about Saved Charts and using Relative Charts, check out our FIN Docs.

Topics from this blog: End User FIN 5.0 FINtastic Tips FINstitute Smart Buildings
Back to all posts