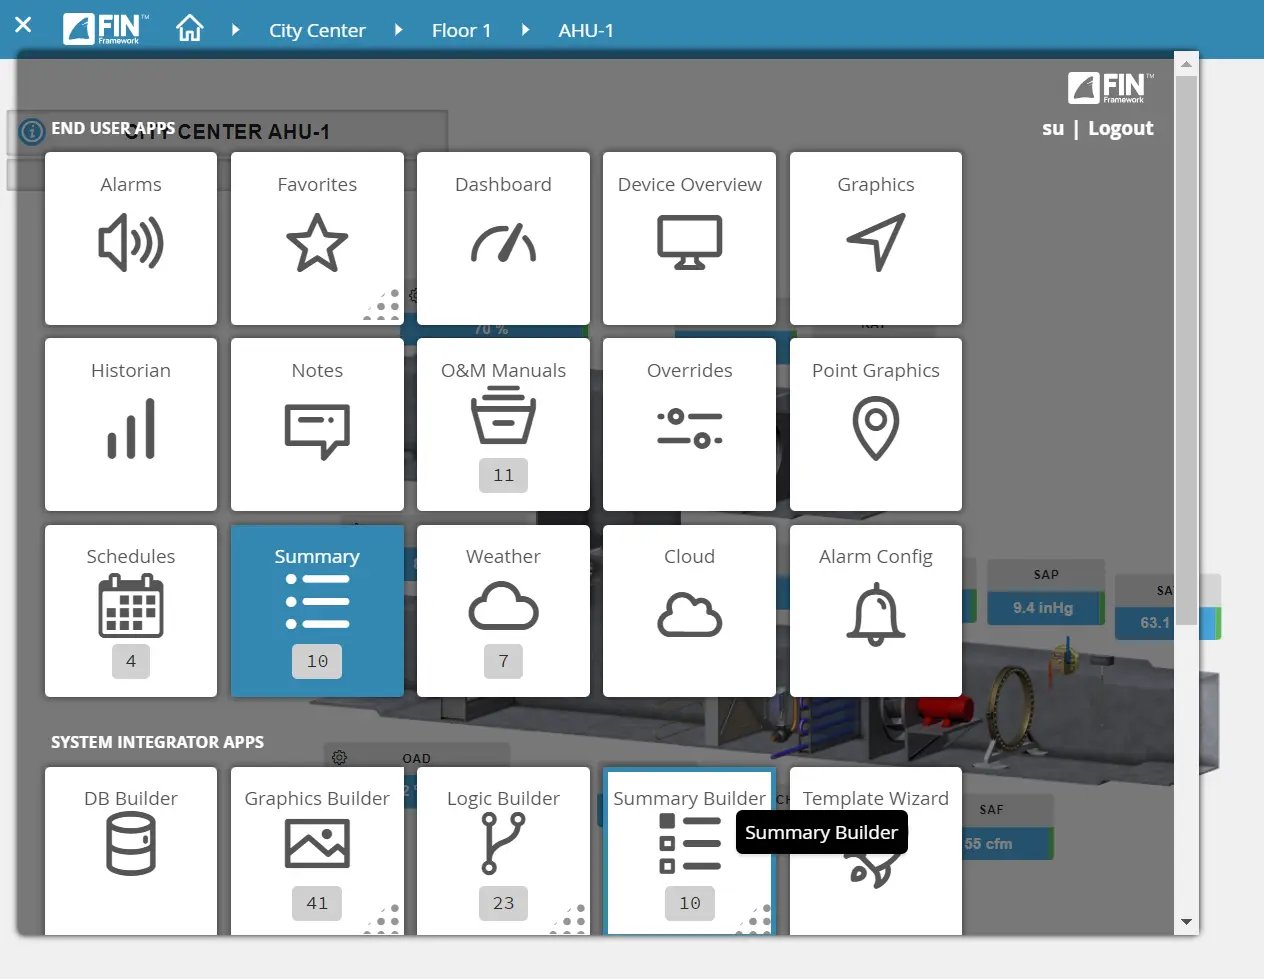
One of the most useful graphics for commissioning agents, system integrators, and end users are the tables of data that summarize details for mechanical equipment, sub meters, and lighting zones. For example, it's often a good starting point to look at a VAV summary of all the VAV boxes that are served by a particular air handler or reside on a particular floor. Unfortunately, hours and hours of application engineering are typically required to build these bespoke tables of data. In today's blog, we will show how FIN Framework changes all that by using its smart app called Summary Builder. It's as simple as running a wizard and answering a few questions, then the summary graphic is automatically created.
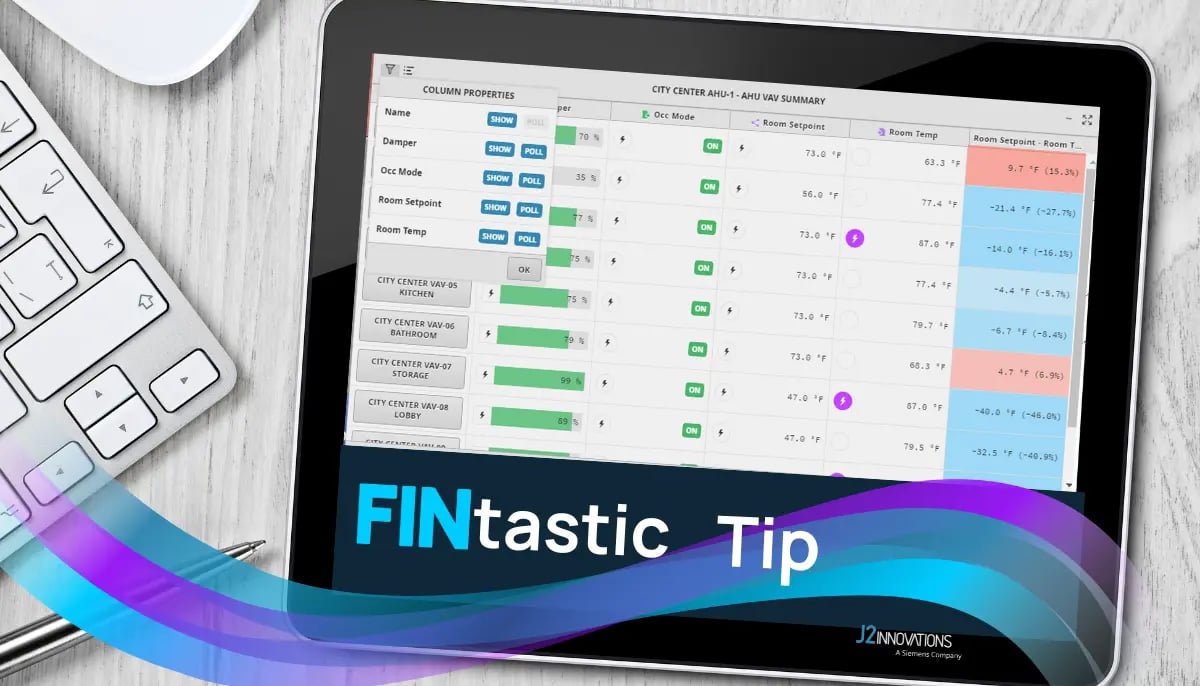
FIN's summary graphics are really cool because they have so many valuable built-in features. For example, a summary of your VAV equipment would show all the room temperatures, set points, and damper positions in a table. You can also filter out and add back in columns of that table for additional information, such as set point, reheat valve, and fan output.
The summary lets you sort by columns so you can see the data organized from highest or lowest. Additionally, there is a summary of the summary at the bottom of the table that shows the min, max, average, and total for each column. But one of the coolest features allows you to compare two columns and automatically calculate the difference, displaying it in a new column (for example, room temperature and room set point).
The new column in the table is also color-coded to visually show zones that are too cool (blue) and zones that are too hot (red). This color coding is also used on floor plans to show the similar performance of zones.
Finally, the new summary builder wizard creates not just one table, but a relativized graphic summary. This means there is a summary for all air handlers for all floors, so as you navigate the project, the corresponding summary will become available at any level of the architecture.
Topics from this blog: Graphics Builder FINtastic Tips Smart Buildings FIN Framework Building Automation System BAS FIN App Suite
Back to all posts


