-4.webp?width=1200&height=686&name=2026%20Blogs%20(1)-4.webp)
For system integrators and facility managers, one of the most powerful visualizations is a graphic that summarizes multiple pieces of similar equipment. Oftentimes, they use this table to get a quick overview of how their building is doing, both from a comfort and control perspective. Over the years the tools and labor to create this visualization has evolved dramatically from an entirely manual process to a wizard-based simplified workflow.
Early automation systems relied on the application engineer to understand and manually reference mechanical drawings to determine relationships within the equipment and systems. With this knowledge in hand, the engineer would manually summarize similar equipment using lists and basic tables to visualize performance data.
In earlier BAS systems, creating these graphics was highly labor-intensive. The tools available required engineers to build each label individually and repeatedly link the underlying data by hand to form the rows and columns of the table. Additionally, mathematical calculations to compare values such as set point and space temperature needed to be created in the control engine, and that column of data required additional labels and linking. These ran in the server, consuming valuable resources.
Then legacy systems evolved to support queries, meaning a dataset could be generated by specifying the points (typically by type and name) needed to populate a table. A new UI widget that supported populating rows and columns from the dataset into a visual table helped dramatically reduce the labor. Although it cut down on manual linking, it required extensive technical knowledge to define the data required and the syntax to complete the query.
The modern day approach to defining relationships between equipment and systems is through the use of metadata, specifically using the reference tag from Project Haystack's data standard. During the integration and data normalization step, the system integrator can now simply define the relationships using tags. These Reference tags get added to show how devices fit into larger systems and dependencies—for example, equipment to floors, floors to buildings, AHUs to VAVs, hot water coils to boilers, and sub-meters to main meters.
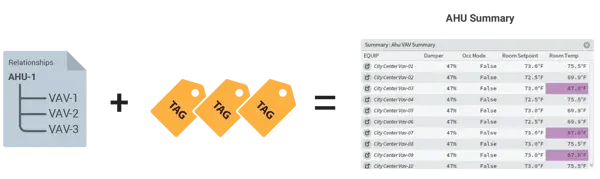
This results in equipment summaries that dramatically reduce the labor to zero using FIN by leveraging Haystack reference tags and a wizard-based workflow to autogenerate both the dataset and the summary table visualization. Additional functionality is also part of the Summary app: sorting, calculating high, low and average values by column, and comparing and calculating two values, such as set point and space temperature.
The evolution of BAS reflects a broader shift in the industry—from manually interpreting drawings, building tables point by point, and running calculations in the server, to query-driven workflows that reduced effort but still demanded deep technical expertise. Today, with Project Haystack tags and FIN’s wizard-based approach, those same equipment summaries become faster to create, easier to scale, and far more useful as operational tools. What was once a labor-intensive engineering task is now a smarter, metadata-driven way to deliver insight, comparison, and ongoing optimization across modern buildings.
To see how semantic tagging and FIN Framework work together to unlock these benefits in practice, explore our deeper dive on the payoffs of Haystack tagging.


Topics from this blog: Project Haystack Smart Buildings Smart Equipment FIN Framework Technology Industry BAS FIN
Back to all posts